Improving our Elevation Profiles
Posted
One of the core principals I’ve had from the start is that as much as possible the walk pages should be automatically generated. The opposite of that is of course writing something like a Wordpress blog post for each walk, manually calculating and entering distance, climb etc (these are all calculated), manually assigning photos (we use geotagging to automatically assign them), manually tagging the walk as coastal, scenic, etc (we determine this with OSM data).
I made this call as it was important to ensure that both the site could scale as we added new walks and allow the features of the site to evolve around the content.
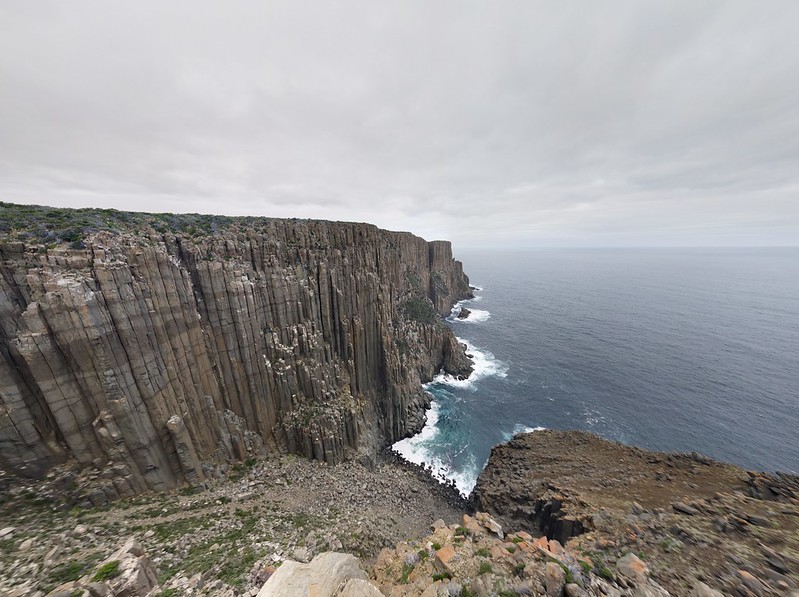
One down side to this approach is it’s harder to manually polish what’s shown on the walk page. Take for example the Cape Raoul Track in the Tasman National Park, Tasmania.

Up until now the total ascent has been listed as 2,792m but this is wrong, in fact if you look at the elevation profile it suffers from the “falling off the cliff” problem where the geometry of the track isn’t lining up with the terrain model and so all those spikes you in the profile are incorrect and adding many fake meters of ascend and descent.

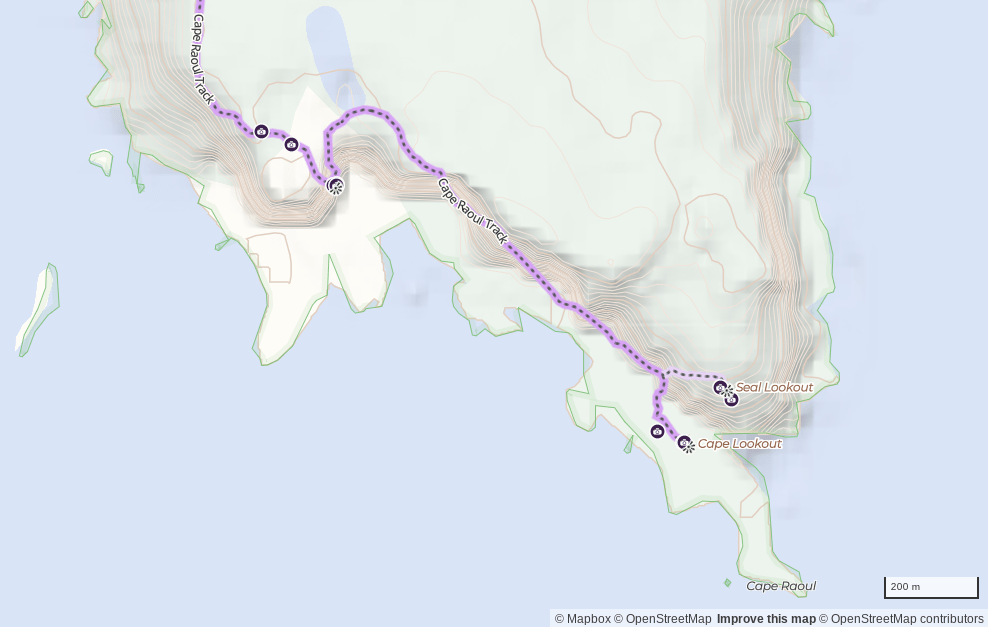
You can see by the (SRTM1) contours and hillshading on the map that there is a serious misalignment as the track actually follows along the top of the cliff.

While the geometry of the track is fairly accurate here based on a few GPS traces the SRTM1 data we’ve been using as well as some satellite imagery sources are misaligned (see a recent discussion about this in OpenStreetMap).
This is tedious to fix manually, while possible it goes against my principle as generating as much as possible automatically.
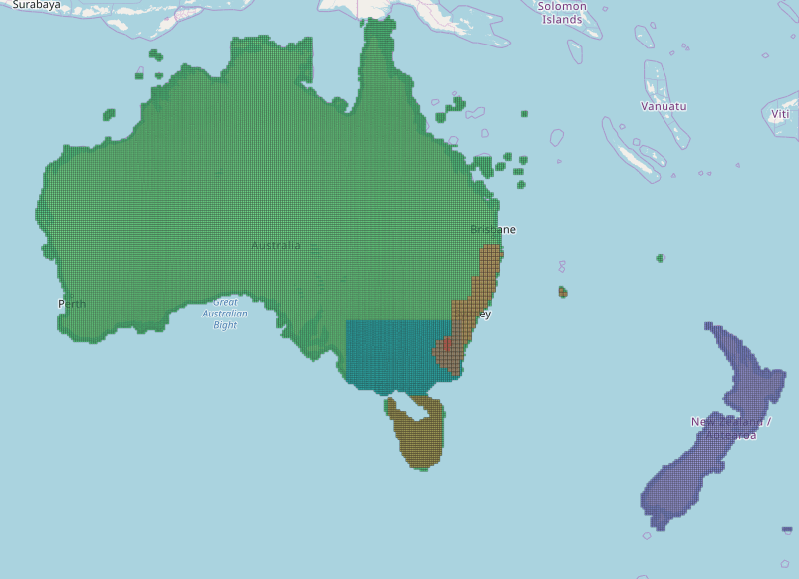
Up until now all ascent and decent calculations and the elevation profile have based on SRTM1 ~30m elevation data, but going forward we’re now using a number of additional sources which have better accuracy particularly around cliff lines. Compare the elevation profile for the Cape Raoul Track but without the “falling off the cliff problem”, the elevation profile never falls below approximately 200m.


With the new terrain data, what was being reported as a 2,792m ascent is now 1,147m, a big difference!
In terms of elevation data sources we are now using:
- SRTM1
- DFSI Spatial Services LIDAR via ELVIS
- ACT Government LIDAR via ELVIS
- Vicmap Elevation DTM 10m
- LIST Tasmania 25 metre Digital Elevation Model

Although it’s only a small change to the user experience, it’s been a huge effort to build out the backend to make this happen stay tuned for a post about that soon.